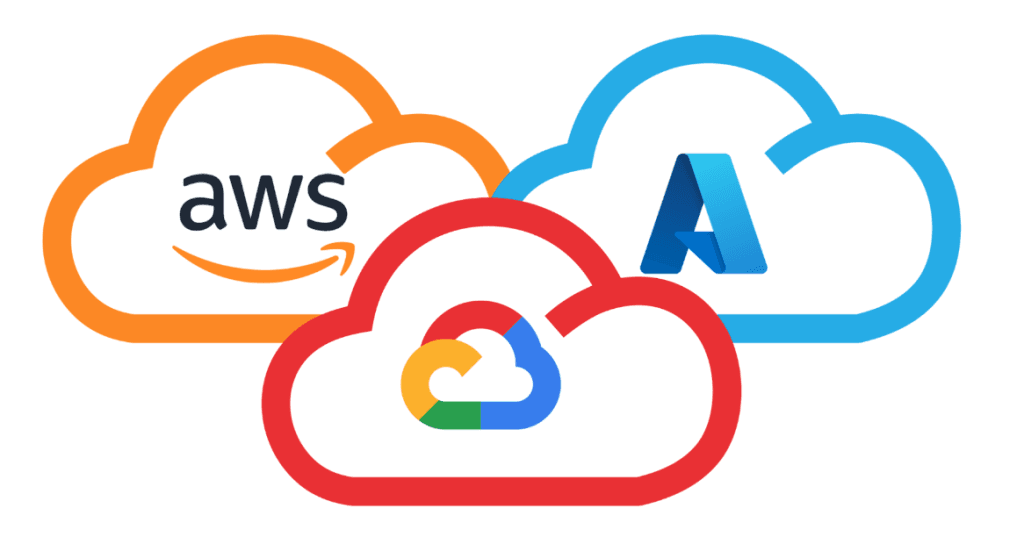
Multi-cloud monitoring tools collect metrics, logs, and traces from workloads running on more than one cloud provider and show them in one place. Each provider ships its own monitoring service, so a team running on AWS, Azure, and Google Cloud otherwise works across three consoles with three data models.
58% of enterprises consider not having the right skills to deploy and manage a complete cloud solution the biggest barrier to securing a multi-cloud architecture. And with the rapid adoption of the multi-cloud, increasingly more enterprises will face these challenges.
Multi-cloud monitoring software keeps an eye on all your resources and provides frontline insight into what is right and wrong, so you can focus on solving pressing issues. This article reviews the top multi-cloud monitoring software solutions, distinctive features, and use cases.
Updated November 2026. The leading multi-cloud monitoring tools are Datadog, Dynatrace, New Relic, LogicMonitor, IBM Instana Observability, Site24x7, Sumo Logic, Sematext Cloud, and Amazon CloudWatch. Datadog, Dynatrace, and New Relic offer full-stack observability across AWS, Azure, and Google Cloud, LogicMonitor and Site24x7 add hybrid infrastructure and network monitoring, Sumo Logic focuses on security and log analytics, and CloudWatch fits AWS-centric environments. Control Plane builds logs, metrics, and tracing into the platform that runs your workloads.
What is multi-cloud monitoring software?
Multi-cloud monitoring software is a tool that assists in managing your cloud workflow in more than one cloud provider. It can encompass the monitoring of all cloud services, including Infrastructure as a Service (IaaS) such as GCP, Azure, and AWS; Software as a Service (SaaS) tools such as Zoom and DropBox; Platform as a Service (PaaS) such as OpenShift and DigitalOcean; and even Functions as a Service (FaaS) and Database as a Service (DBaaS) services.
Although each leading cloud provider offers cloud monitoring, each has metrics and logs. You’ll need a newer solution to get a holistic report of what’s happening in a multi-cloud environment.
Key features in a multi-cloud monitoring software solution
- Automated scalability – Can it automatically scale regardless of your organization’s size, industry, or region? Platforms such as Control Plane autoscale workloads up and down with demand and bill for the CPU and memory each workload reserves, with no contracts or minimums.
- Visibility/Observability – You should look for a solution that enables you to monitor your entire cloud infrastructure – not just specific resources. Plus, it must offer enough observability to differentiate between actual attacks and unusual behavior so that only accurate alerts come to your team.
- Integrations and ease of use – It becomes pretty unhelpful if a solution doesn’t integrate into all the cloud providers and technologies you use. Complex integrations and tool management can be a pain for busy teams, so it’s something to avoid.
- Improved performance – Can it determine which applications and infrastructure are underperforming across different cloud environments and optimize accordingly? For example, Control Plane’s built-in global endpoint routes each request to the nearest healthy location.
- Real-time speed – Things move fast in the cloud. You should be able to monitor and optimize your infrastructure in real time and receive alerts and notifications promptly too.
- Improved security and compliance – Your tool should comply with all key regulations. Plus, it should allow you to prove compliance by recording logs, events, and metrics for auditing and reporting required by laws such as PCI DSS and SOC2.
The 10 best multi-cloud monitoring tools in 2026
1. Datadog
Datadog’s solution fosters collaboration between development, operations, security, and business teams. It goes beyond the cloud environment and helps organizations to integrate and automate infrastructure monitoring, application performance monitoring, and log management to deliver unified, real-time observability of their infrastructure and technology. The platform also covers security (Cloud SIEM and cloud security posture management), real user and synthetic monitoring, and Bits AI agents for incident investigation, with a free trial (as of November 2026).
Best for company-wide unified monitoring.
“Monitoring distributed systems is extremely difficult, but Datadog has made it very easy just to plug and play and understand exactly what’s going on.”
2. Control Plane
Control Plane is a platform for running production workloads on AWS, GCP, and Azure, on your own infrastructure, or on premises, with observability built in. Every workload gets logs, Prometheus-compatible metrics, Grafana dashboards, and OpenTelemetry tracing out of the box, and logs can be shipped natively to Datadog or any OpenTelemetry-compatible backend.
You pay for the CPU and memory each workload reserves, with no contracts or minimums, and customers typically cut compute costs 30 to 50 percent compared with running directly on AWS, GCP, or Azure. The 99.999% availability SLA applies to workloads running at least two replicas in at least two locations.
Best for teams that want monitoring built into the platform that runs their production workloads, on one cloud or several.
“Control Plane eliminates over 50% of our DevOps work. We have two DevOps engineers and they’re running out of things to do. It’s a good problem to have.” (Jude Lee, CEO, IIInigence)
3. LogicMonitor
LogicMonitor is a cloud-based observability platform for hybrid infrastructure, with cloud monitoring for AWS, Azure, Google Cloud, and Oracle Cloud and an agentic AI layer called Edwin AI (as of November 2026). It helps IT, and development teams meet critical business demands and gain visibility in hybrid IT environments, offering customizable alert thresholds, workflows, and escalation chains.
Best for companies looking to enable faster IT innovation.
“The sheer breadth of supported technologies impressed me greatly. LogicMonitor caters to a wide range of systems, including servers, networks, applications, databases, and even cloud platforms like AWS and Azure.”
4. IBM Instana Observability
IBM Instana Observability (formerly Instana) enables companies to automatically discover and map all services and infrastructure, see their interdependencies, and update them in real-time so that development and operations teams can optimize their application performance. It supports OpenTelemetry and adds agentic AI for incident investigation. Pricing starts at $0.03 per Monitored Virtual System (MVS) hour on pay per use or $21.20 per MVS per month on SaaS, with a 14-day free trial (as of November 2026).
Best for companies looking for rapid issue prevention and remediation.
“Instana is easier to install, maintain, and use. It’s significantly more cost-effective, especially for containerized environments.”
5. Site24x7
Site24x7 monitors real user experience on websites and applications on both mobile and desktop devices. At the same time, it also gives DevOps teams in-depth monitoring capabilities to monitor and troubleshoot infrastructure and applications from 130+ global locations. Site24x7 is a Zoho product and also monitors AWS, Azure, Google Cloud, and Oracle Cloud resources, with a 30-day free trial (as of November 2026).
Best for improving the end-user experience.
“We use Site24x7 to inform the public of our services’ status. Site24x7 gives us visibility into all the critical performance parameters of our resources and helps us stay on top of issues.”
6. Dynatrace
Dynatrace mixes observability, security, and AIOps (Artificial Intelligence for Operations). It leverages data across the entire stack to simplify cloud operations and offers AI-generated suggestions for performance improvement. It integrates with 600+ cloud platforms and technologies, including AWS, Azure, Google Cloud, Kubernetes, and OpenTelemetry, stores data in its Grail data lakehouse, and uses its Davis AI engine for root cause analysis (as of November 2026). Pricing is usage-based.
Best for speeding up DevOps with automation and unification.
“We get critical process insight and the ability to deep-dive into metrics, and traces, unlike any other tool. It has been battle-tested on many triage calls. Compared to its competitors, Dynatrace is simpler to use.”
7. Sumo Logic
Sumo Logic analyzes all your cloud data and strongly focuses on continuous security. It enables teams to modernize DevSecOps processes by spotting security vulnerabilities and operational issues faster, thus being able to remediate them more quickly. Real-time visibility is available from code development to deployment, so you can shift security left and speed up time to market. Sumo Logic lists 450+ integrations across AWS, Google Cloud, Azure, and Kubernetes and sells Flex Licensing, a usage-based model (as of November 2026).
Best for companies that want to transform lots of different cloud data into insights.
“Sumo Logic helps the security teams in a cloud-native environment and analyses and parses the machine log data. It ensures application reliability and security against the ever-rising threats in today’s cyber security domain.”
8. New Relic
New Relic enables application engineers to gather real-time insights and data about their software performance- from backend to frontend. It is a much more developer-focused platform; thus, there is a learning curve when getting started. It also includes features such as error tracking and OpenTelemetry, enabling you to standardize all your data and instrument your code. Pricing is usage-based, with 100 GB of free data ingest per month, $0.40 per GB after that, and per-user fees for full platform users (as of November 2026).
Best for engineering teams that want full-stack observability with a free tier.
“New Relic is easy and intuitive to use, with many valuable visualizations on its systems. Agents can be installed in the blink of an eye; if there is no ready-to-use agent, you can use the API to submit your data.”
9. Sematext Cloud
Sematext Cloud integrates with your cloud and container platforms and collects data through logs and metrics. You can predefine what you want to track and customize the monitoring dashboards to see the most relevant information. Sematext scales automatically and monitors all new resources and applications added as your infrastructure scales. You can also monitor user experience – tracking activity on your website to understand what your prospects are most interested in. Sematext Cloud also offers distributed tracing and synthetic monitoring, with a 14-day free trial (as of November 2026).
Best for companies focused on application performance monitoring.
“Sematext Logs provides us a flexible, extensible, and reliable means of real-time monitoring of our environments.”
10. Amazon CloudWatch
Amazon CloudWatch is the AWS monitoring service. The CloudWatch agent collects metrics and logs from on-premises servers, and CloudWatch can query other data sources, including Prometheus and Azure Monitor. It lets you add logs on your resources and applications to track these and visualize activity on your infrastructure. It offers real-time analysis and enables you to store data for 15 months, which can help prove regulatory compliance.
Best for companies with resources and applications on AWS.
“It provides real-time monitoring and alerting, helping us to take the insights and recommendations to make infrastructure changes.”
Multi-cloud monitoring tools FAQ
Answers reflect vendor documentation and pricing pages as of November 2026.
What is multi-cloud monitoring?
Multi-cloud monitoring is the collection and analysis of metrics, logs, traces, and events from workloads that run on two or more cloud providers, such as AWS, Azure, and Google Cloud. A multi-cloud monitoring tool normalizes that data so teams can alert on, compare, and troubleshoot services in one place instead of in each provider’s console.
What are the best open-source multi-cloud monitoring tools?
Prometheus, Grafana, and OpenTelemetry are the most widely used open-source options. Prometheus is a CNCF graduated project that scrapes and stores time-series metrics. Grafana visualizes data from Prometheus and many other sources. OpenTelemetry is a CNCF project that provides vendor-neutral APIs, SDKs, and a collector for traces, metrics, and logs. Teams often combine all three and run them on each cloud, which means they also operate the storage, scaling, and upgrades themselves.
What is the difference between agent-based and agentless monitoring?
Agent-based monitoring installs software on each host or cluster, such as the Datadog Agent, Dynatrace OneAgent, or the CloudWatch agent, to capture detailed OS, process, and application data. Agentless monitoring pulls data from cloud provider APIs and network protocols without installing anything, which is faster to set up but usually less detailed. Most commercial tools support both.
What drives the cost of multi-cloud monitoring tools?
Data volume is the largest cost driver, followed by the number of monitored hosts or containers, user seats, data retention, and custom metric cardinality. Pricing models differ by vendor. New Relic charges per GB ingested above a free 100 GB per month plus per-user fees, IBM Instana charges per Monitored Virtual System, and Sumo Logic uses usage-based Flex Licensing. Sending telemetry out of a cloud can also add provider egress charges.
What does single pane of glass mean in cloud monitoring?
Single pane of glass means one dashboard and query interface that shows data from every cloud, cluster, and on-premises system together. It lets teams correlate an alert in one environment with changes in another without switching consoles or reconciling different metric names.
How is multi-cloud monitoring different from observability?
Monitoring tracks known signals against thresholds and alerts when they are crossed. Observability uses correlated metrics, logs, and traces to investigate failures nobody predicted. Most tools in this list now sell both, and multi-cloud monitoring is the subset focused on covering every provider consistently.
Can AWS CloudWatch or Azure Monitor monitor other clouds?
Partly. Amazon CloudWatch can collect data from on-premises servers through its agent and query external sources such as Prometheus and Azure Monitor, but its deepest coverage is for AWS services. Teams with substantial workloads on several providers usually add a cross-cloud tool or an OpenTelemetry pipeline.
Finding a multi-benefit multi-cloud solution
In a multi-cloud environment, you can’t afford to play around regarding performance and security. You must also handle workloads efficiently, with endpoints from multiple cloud accounts across different cloud solutions. There’s no question that a multi-cloud monitoring solution is needed here – removing the problem of lacking resources and enabling you to overcome most of the other challenges related to multi-clouds.
Whether you’re a newbie at multi-cloud environments or have been there and done that for your company, Control Plane runs workloads on AWS, Azure, GCP, your own infrastructure, or on premises, bills for the CPU and memory each workload reserves with no contracts or minimums, and routes each request to the nearest healthy location through a built-in global endpoint.
You can sign up to try Control Plane here or chat with our team if you require guidance on your cloud migration and management process. We would love to help.